Data conditioning
Load, align, clean, and prepare run data for downstream interpretation.
Phase4 Systems helps inspection firms, pipeline integrity consultants, sensor providers, and infrastructure teams convert raw run data into deterministic event timelines, visual diagnostics, and reporting outputs.
Your inspection tools collect the data. We help turn that data into usable insight.
Raw time-series data may need to be cleaned, aligned, interpreted, visualized, reviewed, summarized, and converted into a report before it becomes useful to technical teams or clients.
The system is designed to help teams identify what happened during a run, when it happened, which sensor channels were involved, and which windows deserve closer review.
Load, align, clean, and prepare run data for downstream interpretation.
Identify pressure fluctuations, drops, rises, and elevated variability windows.
Review accelerometer activity, vibration windows, and motion spikes.
Detect angular movement, orientation shifts, and directional instability.
Evaluate temperature drift, stability, and abnormal variation.
Compare channels to identify overlapping behavior and review-priority windows.
Generate timelines, charts, summary tables, and report-ready figures.
Support dashboards, white-label outputs, and proprietary analytics tools.
The goal is not simply to generate charts. The goal is to produce a repeatable workflow that helps technical teams move from raw data to useful review material.
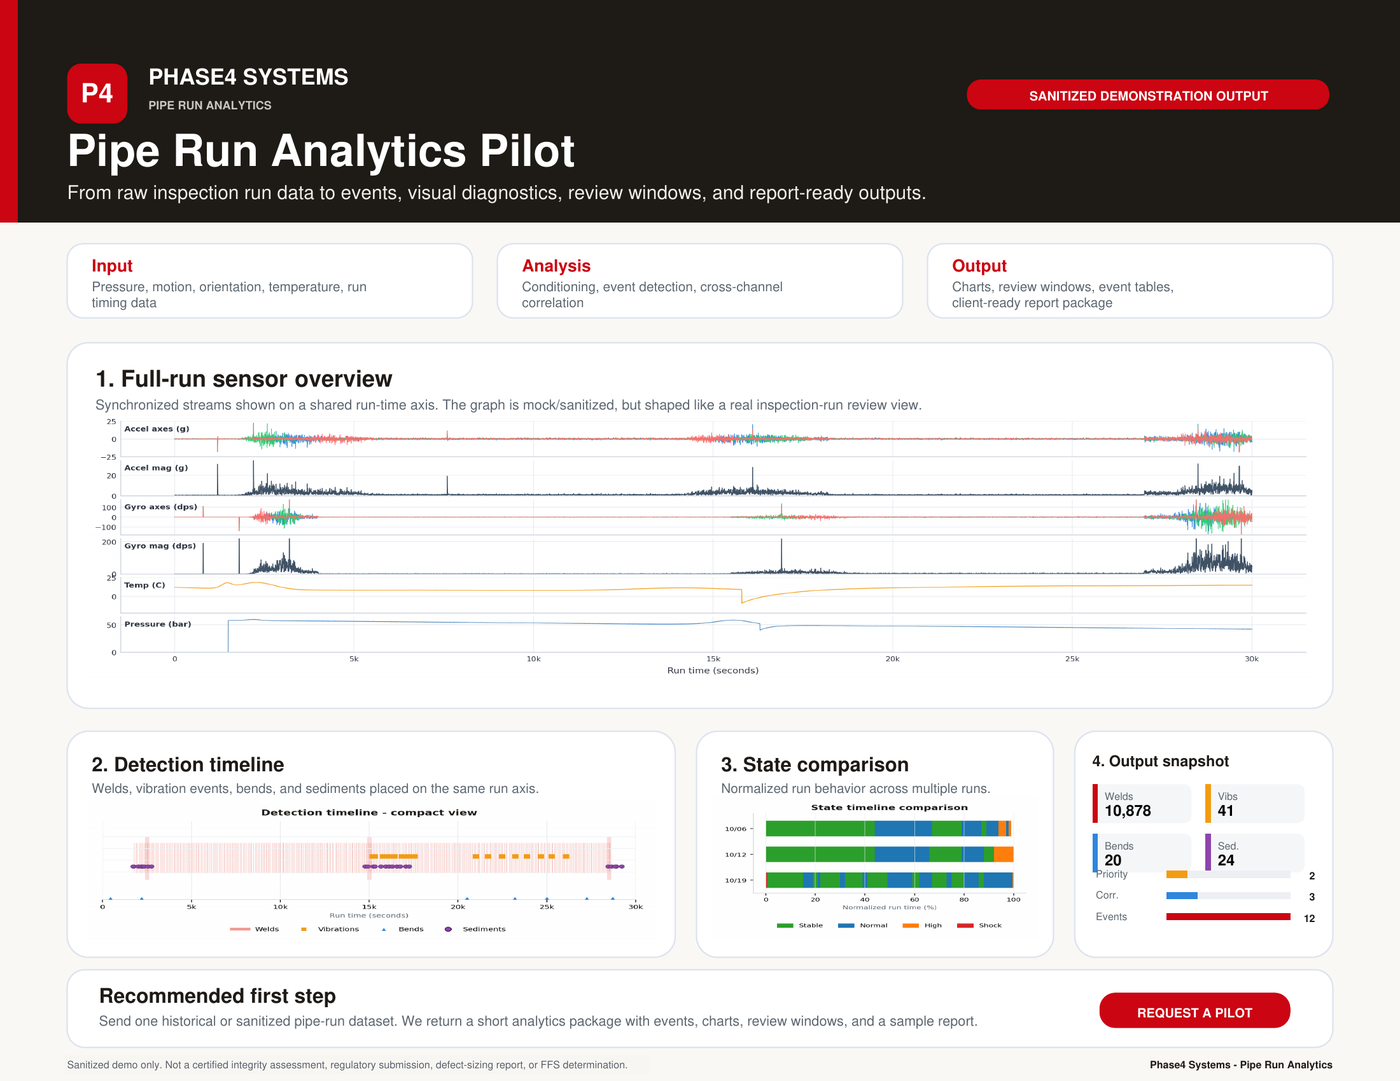
You provide one historical or sanitized pipe-run dataset. We process it through the analytics workflow and return a structured output package showing detected events, visual summaries, correlated review windows, and report-ready figures.
Send a historical or sanitized run file with available sensor streams.
We condition the data, align it to run time, detect events, and correlate activity.
You receive event tables, charts, visual diagnostics, and a short sample report.
If useful, we discuss a repeatable workflow, dashboard, white-label reporting, or custom software layer.
This system supports analytics, visualization, reporting, and technical review.
Phase4 Systems builds software systems that turn complex data and business processes into usable operational tools. For pipe-run analytics, that means combining data processing, event detection, visualization, reporting, and interface design into one practical workflow.
Use the Phase4 Systems scheduler to book a short call. We can review your inspection workflow, discuss the type of run data you collect, and define whether a one-run analytics pilot makes sense.